Contact Tracing is critical to minimizing the spread of COVID-19 in your community. Coronavirus infections are particularly dangerous to vulnerable populations such as retirement homes, elderly family members, medical providers, and front-line service personnel. By collecting and managing the data of your population, you are prepared if and when an outbreak occurs.
The FMS Advanced Systems Group developed Sentinel Visualizer to visualize complex relationships hidden in traditional rows and columns. For instance, schools can store relatively static data on their students, teachers, staff, classes, clubs, sports, siblings, family members, etc. When positive tests occur, one can find common links to quickly identify those who need to be tested and quarantined while limiting the impact on the wider community.
Facebook and Mark Zuckerberg are getting blamed for a large number of issues from promoting fake news, election fraud, mishandling user data, and profiting from selling user data.
While some of that may be true, the Facebook security breach is actually a violation of Facebook API licensing rules by the people who used it. Facebook provided the data and encouraged developers like us to create innovative solutions for the Facebook ecosystem. They weren’t selling the data.They weren’t even charging us to use it.
Our Facebook App with Social Network Analysis and Maps
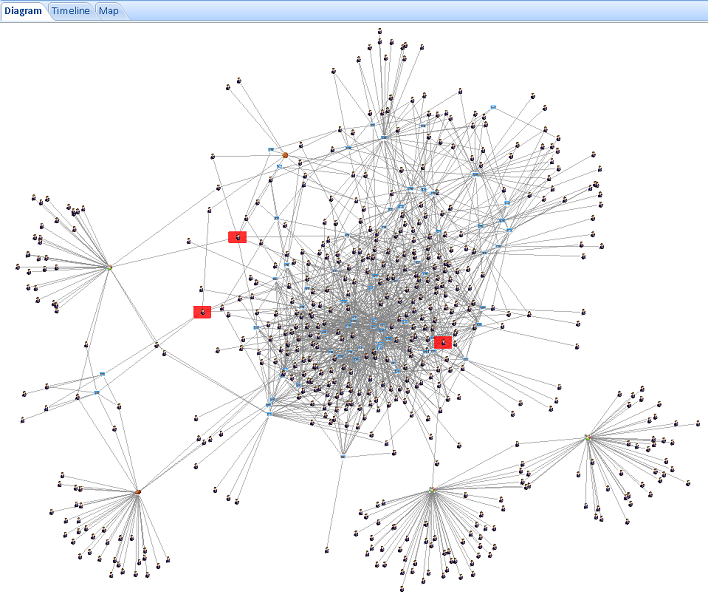
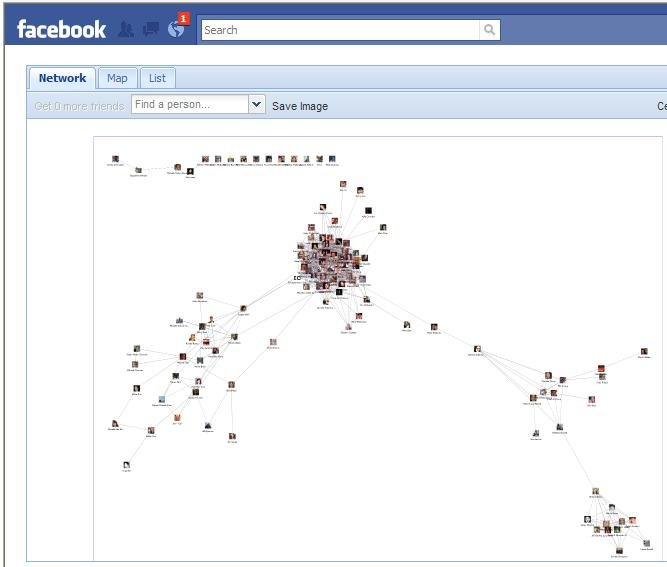
In 2010, we created a Facebook application using our Sentinel Visualizer technology to perform Social Network Analysis (SNA) based on a user’s friends’ friends. It would automatically cluster friends so you could quickly see their groups (high school, college, work, family, in-laws, clubs, etc.).
Each box (picture) was one of your friends, and you could move them around the network, hover over them to get their info, or click on them to go to their page.
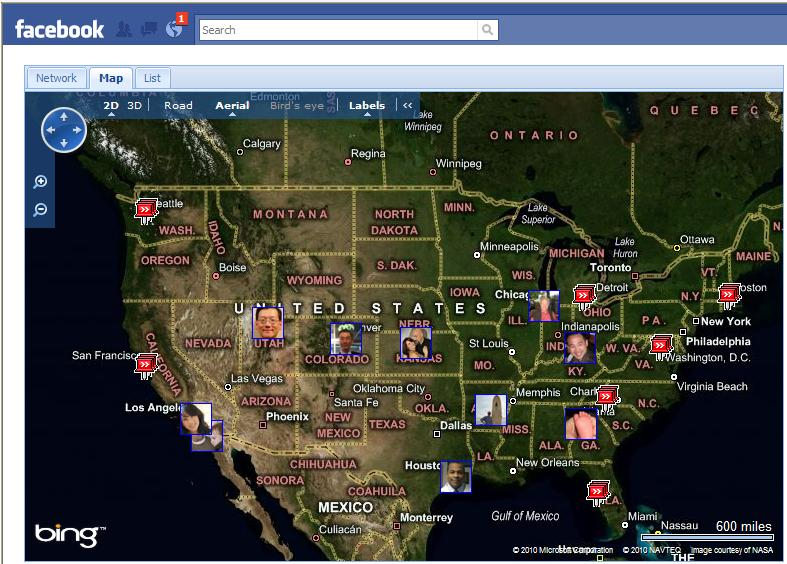
We also plotted friends on a Microsoft Bing Map making it easy to see who were near you or where you were visiting.
We launched our free Sentinel Visualizer Facebook App to a limited number of users and it started to gain followers. People were amazed to see which of their friends knew each other. The application started to go viral. We were having trouble supporting the traffic.
Not Allowed to Save Facebook Data
One of the things developers couldn’t do was to save Facebook’s data. All we collected were the user names and email addresses people provided when they registered our program. Unfortunately, other developers didn’t abide by Facebook’s terms and the data improperly got to Cambridge Analytica and others.
Facebook Stopped Making the Data Available
Our app ceased to work when Facebook limited their APIs and prevented our ability to get to the list of your friends’ friends among your network.
It’s not entirely Facebook’s fault for trying to spur innovation by sharing their data for free. Some developers violated the trust Facebook gave them.
The Full Story
Here’s our new web page describing our experience in detail:
FMS President Luke Chung was a presenter at the Microsoft Access DevCon 2017 in Vienna, Austria in early April.
Before giving two conference presentations, he was sat down and spoke with Philipp Stiefel of codekabinett.com of Germany. Philipp is creating a series of videos discussing VBA development.
How end-users migrate from Excel to Access, then learn how to code
Why people are hesitant to purchase third party products and how FMS overcomes that by showcasing the value we offer
Using tools like Total Access Analyzer to catch errors before shipping and learning best practices
Using the module code in Total Visual SourceBook to address problems we’ve already solved so you can focus on the unique issues in your applications
The value of creating consistent, quality code
How to improve code for developers of all backgrounds
Being in constant “growth” mode to look for ways to become a better developer
FMS Inc. is proud of the quality of products we have produced for the past 30 years. We are honored to continuously be regarded as a leading expert in the Access community. Thank you for supporting us and we hope you enjoy the 20 minute interview!
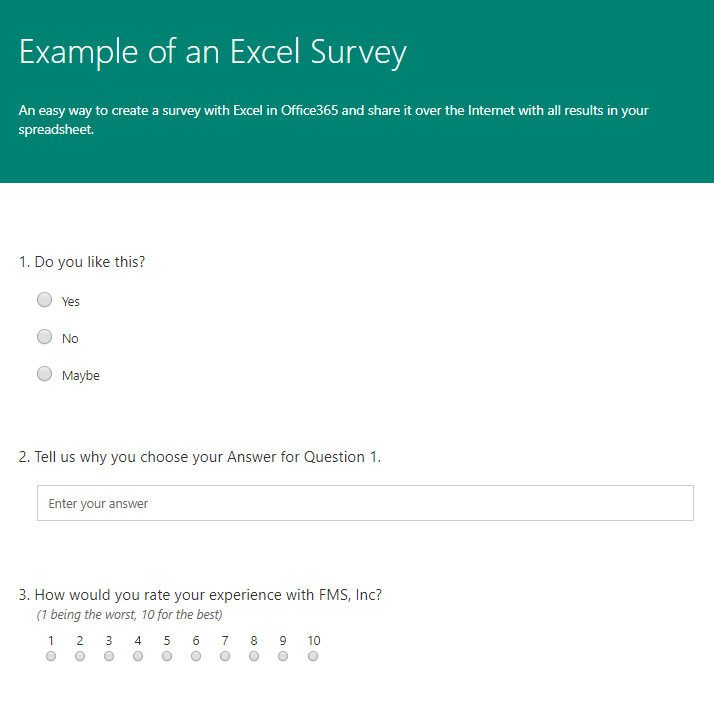
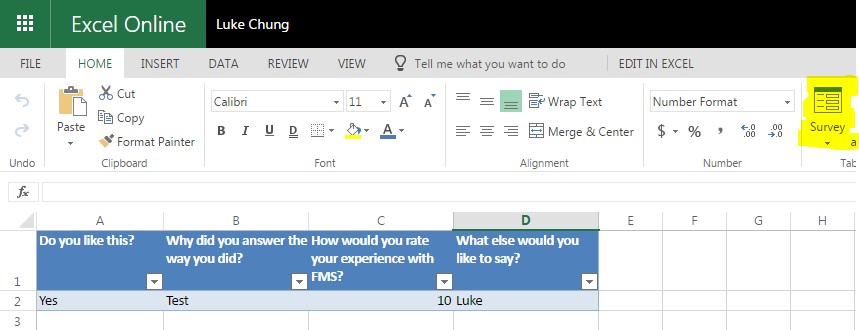
You can quickly create surveys with Excel and make them available online with all results saved in the spreadsheet hosted in Office365. Just create an Excel spreadsheet in Office365 and choose the Survey item on the ribbon to design it.
A link is provided to share with people to respond. They don’t need to have Excel or Office365. Just a web browser. Try our sample by clicking the image below:
Shorten the URL
Excel provides a very long URL to share your survey. By using a site like bit.ly, you can create a shorter one to email to your contacts. This is important to avoid problems when URLs get word wrapped in emails. For instance, this survey is shortened to https://bit.ly/2qmSweG.
Results in Your Spreadsheet
The results go directly into your spreadsheet with each submission as a separate row:
Having the ability to create a survey and see the results in a spreadsheet in minutes, is a terrific tool to help your projects!
We are pleased to introduce new versions of Total Access Statistics for Microsoft Access 2007 and 2003; versions 12.9 and 11.9 respectively. They include the many features we introduced with the latest Access 2016 version.
Total Access Statistics is an add-in that is the most powerful data analysis program for Microsoft Access. It extends the power of Access queries to analyze the data in your local or linked tables. It generates results in tables you can view or include in other queries, forms, and reports. It offers a wide range of statistical functions such as:
Field Descriptives
Financial Cash Flow Calculations
Percentiles
Running Totals and Moving Averages
Field Comparison
Frequency Distributions
Regressions
Advanced Cross-Tabulations
Group Analysis (t-Tests and ANOVA)
Record Analysis and Rankings
Non-Parametric Analysis
Probability Calculator
New Features
Additional percentile types can be assigned to a field in your table
Enhanced data formatting
Improved financial calculations for IRR and XIRR
Updated user manual
Support for Windows 8 and 10
New Add-in and Runtime Library Files
Version 12.9 and 11.9 include new files for the Access add-in. It also has new runtime library files.
A digitally signed MDE library for MDB databases that support users of Access 2016, 2013, 2010, 2007 and 2003.
The Access 2007 version includes an ACCDE runtime library for ACCDB databases for Access 2016, 2013, 2010 and 2007 users
The Access 2003 version includes a runtime library for Access 2000 and 2002 users
Total Access Statistics is now available for Microsoft Access 2016 (32 and 64-bit versions). Running as an Access add-in Wizard, Total Access Statistics generates a wide range of numerical analysis beyond the power of queries. All results are in Access tables that you can add to your queries, forms and reports.
Total Access Statistics includes a VBA programmatic interface with a royalty-free runtime distribution library so you can add the advanced analysis into your Access applications for distribution to others.
Download the Free Trial to experience it yourself.
Owners of Total Access Statistics for earlier versions of Microsoft Access can upgrade at a discounted price.
Total Access Statistics is the most advanced data analysis program for Microsoft Access. It extends the power of Microsoft Access queries with a wide range of statistical calculations including percentiles, frequency distributions, correlations, regressions, rankings, running totals, financial cash flow analysis, data normalization, crosstabs with Chi-Square, t-Tests, ANOVA, non-parametrics, probabilities, and more.
Total Access Statistics is now available for Microsoft Access 2013. Total Access Statistics 2013 includes many enhancements since the prior release of Total Access Statistics 2010:
Support for the 32 and 64 bit versions of Access 2013 with separate add-ins for each
New redistributable runtime libraries to support Access 2013, 2010, 2007, and 2003
Support for Windows 8 (and all Windows versions supported by Access)
Improved performance when analyzing large data sets
For Percentiles, when assigning percentile values to a field in your table, you can specify calculations such as quartiles, quintiles, octiles, deciles, etc. rather than just percentile
Field format is set to Percent for percentage fields in the Frequency, Crosstab (when percentages are in columns), and Chi-Square details tables
When tables are generated from the add-in, the field column widths are resized to show the entire field name and data
With the upcoming 4th of July celebrations, we at FMS are proud to have worked with the National Archives and Records Administration (NARA) over the past year to help them better maintain and preserve the important documents of our nation. Here’s what we did in our new case study, Inspection Software for the National Archives and Records Administration (NARA).
About the National Archives
The National Archives and Records Administration (NARA) is the record keeper for the United States. Of all documents and materials created in the course of business by the United States Federal government, only 1%-3% are important enough for legal or historical reasons that they are kept by NARA forever.
Background
To ensure the quality of work performed by their Facilities Management service providers, the National Archives and Records Administration performs both random and targeted inspections of completed work orders.
Problem
Inspection findings were documented on paper, which ironically, wasn’t efficient for the NARA. Reports were manually created to generate the service results. This manual process was time consuming and prone to human error.
Solution
FMS was selected to create a professional, multiuser system to collect the inspection results electronically and generate a variety of management reports.Within two months, we deployed our solution which offers data entry screens to replicate a variety of existing forms and many new management reports. An intuitive user interface made it easy for users without requiring extensive training. More importantly, we established a solid database foundation to improve NARA processes both today and into the future.
Operational Impact
Stores inspection results into a shared database
Increases efficiency and accuracy of the collection and reporting process
Gathers information and performs statistical analysis in ways that were previously not available
What valuable information can you get out of huge amounts of telephone call records?
The US government is trying to collect all the telephone call data records (CDR) for US and international phone calls though its PRISM program. Does having this information constitute snooping? Is it an invasion of privacy? Or can it really help investigators track, find, and thwart threats?
Does it Matter with So Much Data?
With billions of phone calls, how could anyone possibly find anything of value amid all the innocent, unrelated calls? No one can possibly gain significant insight looking at an Excel spreadsheet or a database showing rows and columns of all those calls. Isn’t it just noise?
How Sentinel Visualizer Analyzes Call Data Records
Without advanced analytics software, the data is overwhelming. Our commercial Sentinel Visualizer program from our Advanced Systems Group provides a platform to gain insight into the massive number of phone calls. It’s about managing large amounts of data, seeing the relationships between entities (phone numbers and people), drilling down where necessary, and filtering based on time, geography, and relationships:
Call detail records are imported into the Sentinel Visualizer database (SQL Server)
Temporal Analysis can be used to filter data to specific time ranges
If information exists for known individuals and their phone number(s), related phones can be quickly identified as warranting additional investigation
Link Traversal Analysis can be performed between two phone numbers to show all the phones related to them through multiple levels, and quickly filter out the unrelated calls to identify the “community of interest”
Numerous reporting and exporting options: print diagrams and customized reports, or export them in image, PDF, Word, Excel.
Sentinel Visualzer helps analysts mine their data to find hidden relationships among people, places and events. Built with Visual Studio .NET on a SQL Server database, Sentinel Visualizer provdes advanced data visualization through link analysis, geospatial mapping, timelines, social network analysis (SNA), advanced filtering and decluttering, and many other tools to maximize the value of data.
As the rampage and manhunt in Boston, Cambridge, and Watertown transpired, MIT Technology Review published an article that mentioned our Sentinel Visualizer product. In the April 19, 2013 article, David Talbot describes the rise of technology to detect the activities of criminals over the Internet and connect seemingly unrelated people, places and things. For more information, visit Building a Picture of the Boston Marathon Bombing Suspects through Social Network Analysis.